August 31, 2014

K12 Online Conference 2014. Igniting Innovation. Free. Online.

Two online events are must do's for educators (teachers--including librarians--and administrators) and teacher education students. Both occur in October each year. One is Connected Educator Month and the other is the K12 Online Conference. Both events are free. Both offer professional development and networking opportunities that, in my opinion, are invaluable.

In last week’s post I shared information about Connected Educator Month from the event's planners. This week I am sharing information about the K12 Online Conference from its event planners.


http://k12onlineconference.org/wp-content/uploads/2014/06/k12online2014-flyer.pdf

About the K12 Online Conference 2014

Igniting Innovation is the theme for the K12 Online Conference 2014.

Scheduled events include:

Monday, October 13…

the next two weeks (starting October 20)…
  • 40 presentations in four different strands, with four presentations posted per day
  • each presentation is a single media file of twenty minutes or less (but not too much less)
  • all presentations are shared under Creative Commons Attribution 4.0 Unported licenses
the strands are...
  • Gamification and Gaming
  • Stories for Learning
  • Passion-driven learning
  • STEAM
Gamification and Gaming (convened by Jose Rodriguez)
How can game thinking, design and mechanics be employed to make learning more engaging and fun? This strand highlights ways educators are using gamification to transform classroom learning and encourage students to level up as they learn knowledge and skills both inside and outside the classroom. Kevin Hodgson (@dogtrax) shares this strand’s keynote during week 1.

Stories for Learning (convened by Susan van Gelder)
Sharing stories is a great way to learn. In the telling and the listening, learning deepens. Stories by students, by teachers, about discoveries, about classrooms… Let’s gather around the virtual campfire for some storytelling. Ben Wilkoff (@bhwilkoff) share this strand’s keynote during week 1.

Passion-driven learning (convened by Karen Fasimpaur)
What does learning look like when it starts with learners’ passions and interests? This strand will cover topics such as Genius Hour, Connected Learning, interest-driven blogging, independent projects, and more. Joy Kirr (@joykirr) shares this strand’s keynote during week 2.

STEAM (convened by Paula Naugle)
How are teachers and others helping students develop skills and a love of learning through STEAM (Science, Technology, Engineering, Arts, and Math) activities and lessons? This strand highlights innovative STEM learning, projects, and ideas, as well as the ways the arts and creativity are included in STEAM. Mike Petrich (@TinkeringStudio) shares this strand’s keynote during week 2.


k12onlineconference.org

How Can You Share News about This Conference with Colleagues and Your PLN?

Download the conference marketing flyer in PDF format (http://k12onlineconference.org/wp-content/uploads/2014/06/k12online2014-flyer.pdf). Forward or print or post this flyer where teachers will see it (teachers’ lounge, beside teacher mailboxes, outside your classroom, or anywhere else it can catch the attention of other educators).

Tweet about the 2014 K12 Online Conference using the conference hashtag (#k12online14). 


Share the K12 Online Conference by putting a linked version of the 2014 square conference logo badge on your own blog or other website. You can download the logo and add it to your site, linking it back to k12onlineconference.org. (See mine on the right-hand side of this page.)


k12onlineconference.org

How Does the K12 Online Conference Work?

The conference is FREE and online. It is open to ANYONE and is organized by educators for educators around the world interested in integrating emerging technologies into classroom practice. One of the goals of the conference is to help educators make sense of and meet the needs of a continually changing learning landscape.


No registration is required. You are welcome to sign the Guest Book.
 
During the conference each year, presentations are posted to the conference blog (http://k12onlineconference.org/). You can also view the presentations
on YouTube or by subscribing on iTunesU.

Archived conference presentations and live events are available. These events are accessible from the navigation links (organized by year) at the top of the blog.

During the conference dates you participate by downloading the presenter’s content or viewing it online, reviewing it, and then posting feedback or comments. Comments can be posted on the conference blog.

The conference schedule identifies when a particular presenter’s content will be available. (After the identified date, the schedule will have a link to the content). You can also attend the culminating live event. Live events provide an opportunity for you to listen to the week’s presenters, ask questions directly and visit with other participants (virtually). It’s a good idea to watch the conference feed for conference information, follow the conference twitter feed, or check back regularly to the conference website.

You can view all the presentations and supporting materials for the 2006, 2007, 2008, 2009, 2010, 2011, 2012 and 2013 conferences.


The conference is NOT a venue for advertising and direct marketing. Anyone is welcome to participate in the conference as an individual.


Ponder / F Delvanthal / CC BY 2.0


8 Tips for First-time Participants
  • Don’t try to take it all in at once. Pick a strand and follow it. View, perhaps, only one presentation per day. Attend the culminating live event if you can.
  • Review the program ahead of time to choose the sessions that most interest you.
  • Check out the presentation teasers to help you decide where to start your conference experience.
  • Work with a colleague to share the information. Just like at an “in-person” conference, go to different sessions and “get the information and handouts” then report back.
  • Get everyone together for a keynote session, then assign people to report back on the key points in one presentation.
  • You could make it a school event and get together after school, at lunch time, whenever to view the conference sessions with colleagues. Pick one that interests you and/or fits your school ‘s goals.
  • If you’re busy all week, remember, the conference is mostly asynchronous (not happening in real time) so you can catch up with the conference later. All links to past conference presentations are accessible using the navigation links at the top of each page.
  • See the FAQs for information about professional development (CPE) credit for participation in the conference.


And most important of all... Don't forget to mark the dates on your calendar for both Connected Educator Month (#ce14) and the K12 Online Conference 2014 (#k12online14)!

August 24, 2014

Connected Educator Month. All month. All free. All around the world.


http://bit.ly/connectededucatormonth

Two online events are must do's for educators (teachers--including librarians--and administrators) and teacher education students. Both occur in October each year. One is Connected Educator Month and the other is the K12 Online Conference. Both events are free. Both offer professional development and networking opportunities that, in my opinion, are invaluable.

In today's post I am sharing information about Connected Educator Month from the event's planners. Next week I will share information about the K12 Online Conference.


Connected Educator Month: Those who do, teach. Own it, worldwide. October 2014.
A celebration of community, with educators at all levels, from all disciplines, moving towards a fully connected and collaborative profession. Convened by the connected education community, with the full support of the U.S. Department of Education, building on the success of previous years with hundreds of new events and activities from dozens of organizations and communities. We’ll be working together, in October and beyond, with all stakeholders, leaving no device unturned, no country or learning environment unexplored. Get involved at connectededucators.org.

http://bit.ly/connectededucatormonth


About Connected Educator Month

Millions of educators and others around the world have participated in hundreds of professional development opportunities as part of Connected Educator Month (CEM) the past two years. Originally developed by the U.S. Department of Education and its partners as part of the Connected Educators initiative, CEM offers highly distributed, diverse, and engaging activities to educators at all levels. Based on its success in 2012 and 2013, the initiative is poised to reach even more educators in 2014, through expanded partnerships and enhanced programming.


Highlights of CEM 2013 included:

  • More than 300 major education organizations, companies, or communities officially participating, including, for the first time, entire states and districts
  • More than 600 national events and activities conducted officially (on the CEM calendar), many more conducted independently
  • More than 1 million web pages and other online locations referencing, promoting, or discussing the event (a 300% increase over CEM 2012)
  • More than 14 million educators and others reached around the world via Twitter alone (more than triple the reach of 2012)
  • Recognition as one of the top educational technology news stories of both 2012 and 2013

For more information about the first two years of CEM, see our reports on the 2012 and 2013 events, and/or this post and video by U.S. Secretary of Education Arne Duncan (who hosted his first Twitter chat as part of the 2013 celebration). Connected Educator Month in 2012 and 2013 was convened by the American Institutes for Research and its partners in the ConnectedEducators project (2010-2014), on behalf of the Office of Educational Technology of the United States Department of Education.


http://bit.ly/connectededucatormonth

CEM 2014

As successful as CEM 2013 was, there are still educators who are not connected, and many more who are not yet taking full advantage of the opportunities connected education affords. More broadly, the field of connected education itself is still in need of further stimulation and development. Based on participant feedback, we hope to:

  • Make the event more fully global, to better incorporate learnings from around the world, supporting multiple countries in the development of full event slates as part of the celebration
  • Make the celebration more fully mobile and blended, in reflection of trends in educational practice and educator use
  • Provide a greater emphasis on collaboration in our planning, tools, and activities, as the logical next step beyond connection, and address participants’ desire for a more action-oriented approach (2x+ as many events were collaborative in 2013)
  • Launch a series of ongoing connected education initiatives during the month (our own and others) to keep momentum building throughout the year, as well as develop more year-round resources (like 2013’s district toolkit)
  • Include more events/activities that pull in other education stakeholders—parents, students, whole school communities, policymakers—to magnify the event’s creative impact We also expect to enhance CEM’s editorial programming and infrastructure to keep the event fully accessible as it continues to grow, as well as engage in more extensive capacity-building to empower the broader community to take more ownership of the celebration.

Connected Educator Month 2014 is being convened by a group of core partners in collaboration with a wide range of participating organizations and funders.


August 18, 2014

Tools to Design Graphics Pages

Brent Schlenker describes two interesting tools for creating graphics, Canva (https://www.canva.com) and Placeit (https://placeit.net/), in a recent blog post. I decided to try Canva... and then to compare it with PicMonkey's (http://www.picmonkey.com) design and collage features. (Note: this post has been modified since its original publication earlier today.)
 
Designed w/ Canva using my own photo
Designed w/ PicMonkey using my own photo
    
Designed w/ Canva using my own photos
Designed w/ PicMonkey using my own photos

Both applications are easy to use. Canva is a design tool which provides photo-editing options. PicMonkey is a photo-editing tool which has options for designing pages and creating collages.

I find PicMonkey easier to use, but I'm sure that my experience using it plays a large part in that. This is my first time trying Canva. Both applications provide useful content such as fonts and graphics. You can use each well for free, but both also have additional features and/or content available for a cost.

Both applications were easy to use for my first experiment, the two graphics pages at the top of this page. I used the blog graphic page in Canva and the design option in PicMonkey. Using PicMonkey feels more comfortable, but then I have used (and have been pleased with) PicMonkey for a long time.

After publishing this post earlier today I decided that a fair comparison requires me to also create something more challenging. So, I designed the themes posters displayed above. Canva is rather easy to use for this task. I can tilt the photos for a more casual look, although I chose not to do that for this test. I particularly like two features: (1) the ability to arrange individual photos forward or backward (on top of or behind other photos) and (2) being able to arrange the photos free form rather than in a matrix.

The design option in PicMonkey did not give me the flexibility I need for the themes poster. PicMonkey's collage option works fairly well, however. One feature I would like to have available when creating a collage is the ability to arrange an individual photo forward or backward when it overlaps another photo.

Angie Nelson also tried Canva and decided to compare it with PicMonkey. Read her blog post to see how she compares the two applications. (Hint: she also sees pros and cons with each.)

At this point PicMonkey is still my go to application for much of my work with graphics, including photos. But, it's good to know there's another application with a different approach available.

Do you use PicMonkey or Canva to design graphics pages? Or do you have a different tool that you use?

August 10, 2014

Teaching with Wikipedia Watchlists

United States Capitol Building, The National Mall, Washington, DC / Jeffrey Zeldman / CC BY 2.0

Michael Gallagher (http://michaelseangallagher.org/), an assistant professor in Seoul, Korea, was inspired by the tweetbot that tweets changes to Wikipedia that come from the IP range of the U.S. Congress. Gallagher’s plan is to ask his students to use Wikipedia’s watchlists to follow a topic… and then to write blog posts based on their observations concerning the authenticity, reliability, and transparency of edits that are made.

So I decided to experiment. I created my own watchlist in Wikipedia. I have placed fractals, Segways, ancient Egypt, Yazidis, and educational technology on my watchlist.

When checking my watchlist I found that I could click on diff to see in context the changes that had occurred… or I could click hist to see a list of all the revisions. It was interesting to see small changes that improved the writing style and larger changes that indicated new or additional knowledge.

Viewing the revisions is a lesson itself. The editors of the topics on my watchlist made changes relating to content, writing style, grammar, and authenticity. Discussion of suggested changes ranged from gentle recommendations and expressions of thanks to passionate sharing of differing opinions.

Watching articles in Wikipedia evolve is an interesting way to learn more about research, collaboration, and the topics being watched. I see many uses for this technique. If you are interested in trying this idea, you may want to read Gallagher’s article (http://michaelseangallagher.org/wikipedia-watchlists-as-teaching-tools/). He describes how to set up your own watchlists and how to organize this project for the classroom.

August 3, 2014

Workflow for Creating Infographics

Good tools exist to help us create infographics nowadays. (See Creating an Infographic and Considering Another Infographic Creation Tool for ideas.)

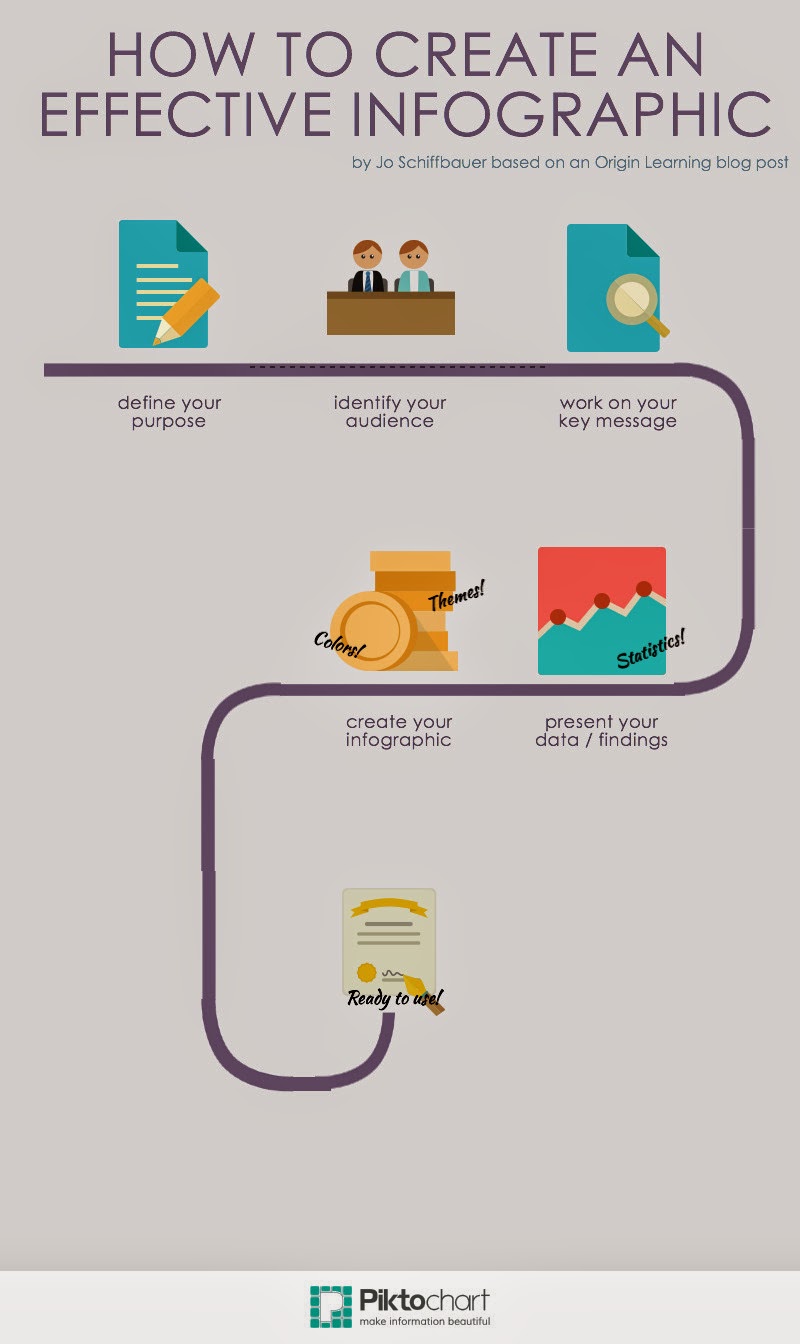
But… what is your process—your workflow—for the creation process? Origin Learning suggests these steps in How to Create Successful Infographics?:
  • define your purpose
  • identify your audience
  • work on your key message
  • present your data/findings
  • create your infographic
Here’s an infographic I created in Piktochart to illustrate their recommendations:


I appreciate my PLN for sharing what they have learned!